The official launch will be at NYU’s Library, most likely at 4:00 p.m. Co-author Lisa Sutherland will be present. Details and registration to follow.
I’m on the USDA’s mailing list for press releases and learned that it had updated its map of plant hardiness zones based on the lowest minimum temperature expected over a 30-year average period.
USDA’s announcement of its new hardiness map said “When compared to the 2012 map, the 2023 version reveals that about half of the country shifted to the next warmer half zone, and the other half of the country remained in the same half zone.”
The new map is interactive. You can click on it to see your zone. My Manhattan zone is 7b.
It was 6b when I moved here in 1988, meaning that the lowest expected winter temperature was minus 5 to zero degrees F. The zone is now 5 degrees higher.
My apartment has a terrace on which I grow food and other plants in pots.
I love the rosemary hedges in California and I tried growing rosemary on my terrance. Until a few years ago, it behaved as an annual and did not survive the winter.
Now it does.
The USDA’s announcement did not mention climate change.
This induced Civil Eats to headline its excellent report on the zoning changes The USDA Updated Its Gardening Map, But Downplays Connection to Climate Change.
It’s not that the USDA doesn’t recognize the role of climate change. It’s just that its various sub-agencies don’t talk to each other.
I did a little digging and came up with an archived site, Climate Change Pressures in the 21st Century.
This took me to a July 26, 2022 report.
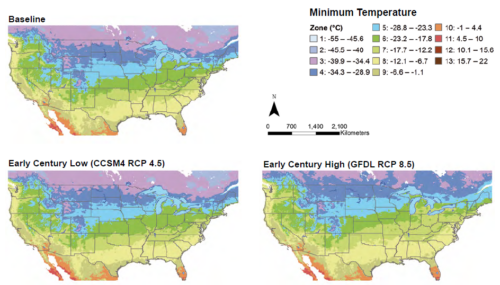
This, in turn, took me to the USDA’s informative 2018 analysis, Assessing potential climate change pressures across the conterminous United States: mapping plant hardiness zones, heat zones, growing degree days, and cumulative drought severity throughout this century.
In the era of persistent climate change, it is important that we consider how continued perturbations to our climate system may intensify through the end of the century (U.S. Global Change Research Program [USGCRP] 2017). Further, it is important to evaluate these potential changes under alternative scenarios to gauge the potential magnitude of these changes. By focusing on four key metrics related to plant growth and survival, but also of key interest to human well-being, we map and summarize projections of growing degree days, plant hardiness zones, heat zones, and cumulative drought severity across the conterminous United States throughout this century
This report lays out what’s happening now along with predictions for each of those metrics.
For plant hardiness zones, Baseline refers to mean absolute minimum temperature for the 30-year period, 1980-2009. Early century is 2010-2039.
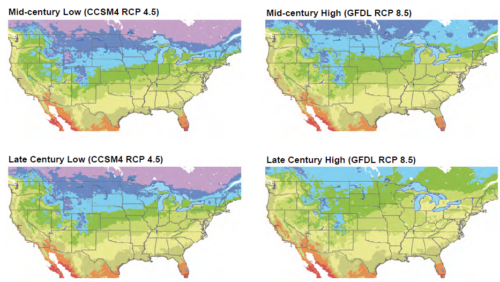
Here are USDA’s scientists’ low and high estimates—predictions—for mid-century (2040-2069) and late century (2070-2099).
Climate change is occurring much more rapidly than had been predicted. Look at what’s happening in Alaska, Greenland and Antarctica, for example.
It feels as though New York’s climate is approaching that of what used to be typical for Northern California.
My parsley is already behaving as a perennial and rosemary seems to be doing just fine.
I’m expecting an early spring.
The official launch will be at NYU’s Library, most likely at 4:00 p.m. Co-author Lisa Sutherland will be present. Details and registration to follow.
