The Glynwood Center for Food and Farming is hosting this event. Details to follow.

The USDA has released its latest data on sugar production and the 20-year downward trend continues.
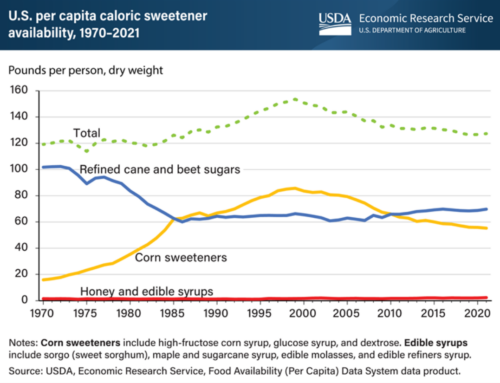
The chart is based on data from the USDA Economic Research Service’s (ERS) Food Availability (Per Capita) Data System,
Availability means total amount produced, less exports, plus imports; it is a proxy for consumption (but undoubtedly higher than actual consumption).
In 2021, total caloric sweeteners (meaning all kinds of sugars and syrups) had dropped by 17% since 1999, the peak year for sugars availability.
Almost all of the change is due to the drop in availability of corn sweeteners.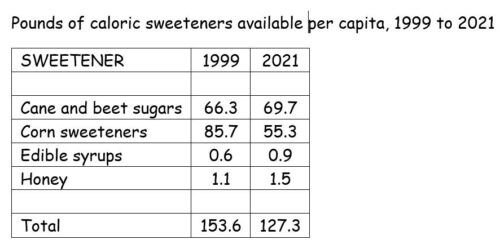
Why the drop in corn sweeteners? Corn syrup used to be much cheaper than cane and beet sugars. But now that so much of it is grown to produce ethanol biofuel, its cost is about the same so there is no point in using it except in products where it works better—soft drinks, for example.
The drop in overall sugar availability looks like a healthy trend. But the prevalence of overweight and obesity continues to rise in children and adults.
There are still plenty of sugar calories available in the food supply.
The 127.3 pounds available in 2021 works out to a whopping 158 grams per person per day, three times the upper recommended limit and about 5 ounces.
If someone is producing that much sugar, or making sugary products, that person wants to sell it.
You are the target of those sales efforts.
If you try to resist, you are fighting the entire food system on your own.
Courage!
The Glynwood Center for Food and Farming is hosting this event. Details to follow.
