Let’s Ask Marion: Can It Really Be Healthier To Be Overweight?
Every now and then, Kerry Trueman challenges me with a difficult question about some current topic. Our most recent exchange, published yesterday in the Huffington Post, is about the so-called “obesity paradox” (defined below).
Trueman: There’s a brouhaha in the blogosphere over Paul Campos’ NY Times op-ed in which he claims that our current definition of what constitutes a ‘healthy weight’ is dead wrong. Campos cites a new analysis from The Journal of the American Medical Association claiming that overweight or obese individuals have a lower mortality rate than people whose weight is ‘normal.’
He speculates that our obsession with obesity is a misguided and manufactured controversy foisted on us by the multibillion dollar weight loss industry and Big Pharma. Marion, you’ve been called a lot of things over the years, but have you ever been accused of being in cahoots with Jenny Craig and Eli Lilly?
Nestle. I love it when people invoke conspiracy theories to deny that obesity raises disease risks.
Paul Campos is a lawyer. He views matters of diet and health from a legal perspective. From that viewpoint, if a statistical analysis shows little effect of obesity on mortality except among very obese people, then nobody need be concerned about weight gain except at the extreme.
If only the science of diet and health were that simple. Scientists, alas, must struggle with a number of vexing questions about such studies:
- Does a finding of statistical significance necessarily imply clinical or biological significance?
- Do statistical findings based on populations necessarily count for individuals?
- Do statistical associations provide guidelines for behavior?
- Are the methods used in statistical studies adequate to draw conclusions about behavior?
We are talking here about a huge meta-analysis of 97 studies of obesity and mortality carried out by Katherine Flegal and her colleagues at the National Center for Health Statistics.
When I read papers by excellent statisticians published in prestigious, peer-reviewed journals, I start by taking the results at face value. Then I ask critical questions about what the results might mean.
I found the figures in the paper difficult to follow so I’ve summarized the results below:
RELATIONSHIP OF WEIGHT CATEGORY TO THE RISK OF MORTALITY.
| WEIGHT CATEGORY | BMI RANGE | MORTALITY RISK (RELIABILITY) |
| Normal | 18.5 – 25 | 1.00 |
| Overweight | 25 – 30 | 0.94 (95% CI, 0.91-0.96) |
| Obesity, Grade 1 | 30 – 35 | 0.95 (95% CI, 0.88-1.01) |
| Obesity, Grades 2 and 3 | >35 | 1.29 (95% CI, 1.18-1.41) |
My interpretation: Compared to people with BMI’s in the normal range, those with BMI’s considered overweight or somewhat obese display no increased risk of mortality. Indeed, those in the obesity grade 1 category may have a slightly reduced risk. The study only finds an increased risk of mortality—by 29%—when the BMI exceeds 35.
My first reaction? This is not news.
Since this is a study of previous studies, we’ve seen results like this before. Flegal herself published a similar analysis in JAMA in 2005. In that paper, she presented the results in a way that is easier to visualize:
RELATIONSHIP OF BMI TO MORTALITY AT VARIOUS AGES

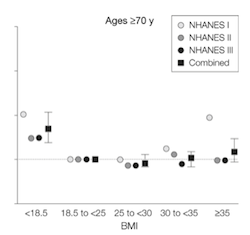
These earlier results show what is called a “J-shaped” curve, meaning that the risk of mortality increases at BMI’s below as well as above the normal range.
The new study is consistent with these earlier—and equally controversial—results.
But the earlier results point to some of the difficulties in interpretation.
- What’s going on at the lower end of these curves?
- Are mortality results skewed by people who are ill and weigh less?
- Is BMI an adequate indicator of health status?
At the moment, there is no way to answer these questions at a level of precision that might satisfy legal thinkers.
What we do know is that obesity above the normal range sometimes—never always—raises the risk for chronic diseases like type 2 diabetes, heart disease, and others. Risk is about probability. Risk never implies legal certainty.
It seems clear that for some people—perhaps many—having a chronic disease does not cause a decrease in lifespan. Since 1970, people throughout the world have gained slightly more than ten years of life expectancy overall, but are now spending many more years living with injury, illnesses, and disabilities—conditions caused by cigarette smoking, excessive alcohol consumption, and poor diet.
With respect to overweight, this is sometimes called the “obesity paradox,” understood as the survival benefits of modest overweight and obesity for people who already have a specific medical condition. For them, many studies—not all—show that survival is modestly better at higher weights.
The Flegal study deals only with the statistical significance of the mortality survival component of the paradox. It does not deal with issues related to the effects of obesity on quality of life.
As a result, some of my colleagues have made harsh comments about the study, calling it “a pile of rubbish.”
I wouldn’t go that far. The study is what it is—a statistical meta-analysis. It’s up to scientists and clinicians to figure out whether statistics like these have meaning in the real world.
In the real world, it doesn’t take much overweight to induce type-2 diabetes in susceptible individuals, and many people—not all—with type-2 diabetes can completely eliminate symptoms by losing a few pounds.
Campos may be willing to let his weight go to where it will and take his chances that statistics are on his side. That’s his choice.
As for me, I’d prefer to avoid weight-related illnesses for as long as I can. I’m hedging my bets and continuing to watch my weight.