The official launch will be at NYU’s Library, most likely at 4:00 p.m. Co-author Lisa Sutherland will be present. Details and registration to follow.
In this strange era of social distancing, I am catching up on items of interest, this one on USDA’s Selected Charts from Ag and Food Statistics, published in February this year.
These cover the ag and food sectors, the rural economy, land and natural resources, farm income, production, food spending and prices, food consumption, trade, and food security.
I love charts. These are especially informative (and date from when USDA’s Economic Research Service was still functional).
Examples:
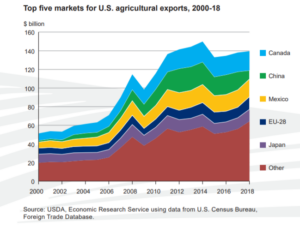
This is one reason why China is so important to our food economy.
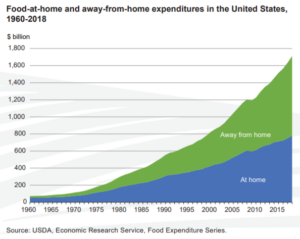
And here’s why the current Coronavirus crisis will be so tough on the restaurant industry:
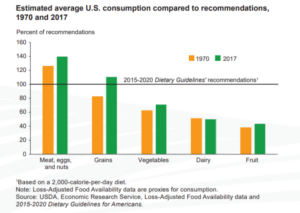
At a glance, we can see what dietary recommendations ought to be saying, although the grouping together of meat, eggs, and nuts is not particularly helpful in understanding what’s going on here.
The other charts—there are lots of them—are worth a look and have much to teach. They make me even sadder about the loss of two-thirds of ERS staff when USDA moved the agency to Kansas City.
The official launch will be at NYU’s Library, most likely at 4:00 p.m. Co-author Lisa Sutherland will be present. Details and registration to follow.
