by Marion Nestle

Currently browsing posts about: Soft drinks

Mar 6 2017

Food-Navigator-USA Special Edition on Beverages

Here is another one of FoodNavigator-USA’s Special Editions, meaning collections of its articles on specific topics written mostly from the perspective of food beverage companies.  This one is on trends in commercial beverages, and is highly relevant to food politics.

Special Edition: Beverage trendwatching

Few sections of the store are as dynamic as the beverage aisles. Meanwhile, the pressure to ‘clean up’ labels continues unabated. But how can we distinguish passing fads from sustainable trends? And who are the entrepreneurial companies driving innovation in this category?

Feb 27 2017

House Agriculture Committee Chairman Mike Conaway (R-Texas)

The chair of the House Ag Committee , Mike Conaway from Texas, provides his votes on issues summarized in a handy chart.  ‘

According to Politico, his opinion on whether SNAP should omit sugary beverages is unclear, although

He did offer his take on sugar-sweetened drinks: “Sugary drinks have a clear impact on people’s health, but if we eliminated them off the face of the earth, I don’t know that obesity rates would be any different.”

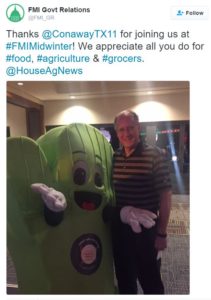
And then there’s The Food Marketing Institute , which posted this appreciative tweet:*


Feb 22 2017

Taking sodas out of SNAP: the debate

I’m out of the country for a few weeks (México) and missed the House hearing on whether SNAP-eligible food items should continue to include sugary beverages.

From what I gather, most witnesses opposed any change in the program, with one from the American Enterprise Institute the lone holdout.

As I discussed in the chapter on SNAP in Soda PoliticsI continue to think that taking sugar-sweetened beverages out of the package is a no brainer.

  • They are sugars and water and have no nutritional value.
  • Tons of research links their consumption to a higher risk for obesity and its consequences.
  • SNAP recipients spend a lot of taxpayer money on them.
  • SNAP recipients may well have worse diets and higher proportions of chronic disease than equally poor people who do not get SNAP benefits.
  • Surveys say that SNAP recipients would not mind this change.
  • SNAP recipients can always buy sodas with their own cash.

I recognize that not everyone sees things this way.  I suspect that people opposed to this idea are worried that any change to SNAP will leave it vulnerable to cuts, and they could well be right.

Here are their arguments:

Politico provides some sound bites on the topic:

  • “Food surveillance violates the basic principles of this great country.” — Rep. David Scott (D-Ga.)
  • “What can we do to incentivize rather than punish?” — Rep. Rodney Davis (R-Ill.)
  • “If you want to do a pilot program, I’m happy to co-sponsor one at the White House. I’m worried about our president’s eating habits.” — Rep. Jim McGovern (D-Ma.)

The state of Maine, however, has just renewed its request to USDA to remove sugar-sweetened beverages and candy from SNAP-eligible items.

Maine believes the purchase of sugar sweetened beverages and candy is detrimental to the health of the SNAP population, and is antithetical to the purpose of the SNAP program.

SNAP is supposed to be a nutrition program, no?  Nutrition is about a lot more than calories (and this from someone who wrote a book about calories).

Feb 17 2017

Weekend resources: a roundup

Jan 31 2017

Are we drinking less soda? The industry says yes.

The CDC has just released two reports on consumption of sugar-sweetened beverages, one for adults and one for children and adolescents.

For adults ages 20 and over, the CDC says:

  • Half drink at least one sugar-sweetened beverage on any given day.
  • These contribute 145 calories per day or about 6% of total calories.
  • The amount consumed declines with age.

For kids ages 2 to 19, the CDC says:

  • More than 60% consume at least one a day.
  • Sugary drinks provide an average of 143 calories a day or 7% of total calories.
  • Roughly 10% of kids drink 3 or more per day.
  • Kids ages 12 to 19 drink the most.

The Washington Post tracked the trends.  The decline in consumption of sugary drinks has slowed down from the peak in about 2000.

Is this trend real?

These figures are based on self-reported intake (or parents’ reports of their kids’ intake) in the National Health and Nutrition Examination Survey (NHANES).

I much prefer industry data on sales, which don’t have to deal with the messy business of self-reports.

Fortune Magazine, for example, says soda sales have declined for the last 11 years.

The downward trend is good for public health.  May it continue!

Jan 11 2017

What SNAP recipients buy at one big retail grocery

Advocates have been pressing USDA for years to (1) get data on what SNAP recipients buy with their benefits, and (2) permit pilot studies of what happens to purchases of soft drinks if you exclude them from the benefit package.

In 2012, I did a post on the 2012 SNAP to Health report.  Its recommendations:

  1.  Protect SNAP benefits.
  2.  Collect data

Lots of people have been trying to get USDA to produce data.  Anahad O’Connor, the author of the New York Times account, filed a Freedom of Information request with USDA.  In response, USDA sent him a report it had commissioned from IMPAQ, a “beltway bandit” consulting firm.  His story is here (I’m quoted).

Now we have a partial answer.  IMPAQ analyzed data from one large, unnamed retailer (could it be Walmart?).

Here’s USDA’s summary of the study (and here’s the complete study).

The USDA says the study shows that SNAP recipients buy pretty much the same amounts of what everyone else buys.

Summary category data show that both SNAP and non-SNAP households focused their spending in a relatively small number of similar food item categories, reflecting similar food choices. The top five summary categories totaled about half of the expenditures for SNAP households and non-SNAP households (50 versus 47 percent). Commodity-level data (in the full report) show that both SNAP and non-SNAP households made choices that may not be fully consistent with the Dietary Guidelines for Americans.

My reading of the report suggests that in this study, SNAP recipients spent more of a combination of their SNAP benefits and their own private money on:

  • Sugar-sweetened beverages
  • Hamburger
  • Frozen meals
  • Salty snacks
  • Lunch meats
  • Flavored milk
  • Kids cereals
  • Frozen French fries
  • Convenience foods in general
  • Infant formula

The report does not discuss why these differences might exist but it would be interesting to find out.

If sugar-sweetened beverages really comprise 9.5% of purchases, that comes to $6 billion a year.

That’s why taking them off the list of eligible foods is worth a try.

Recent SNAP news

The USDA is sponsoring a pilot project to allow SNAP participants to buy foods online from certain retailers, including Amazon in three states, Fresh Direct in New York, and various grocery chains in other states.

The idea is to make it easier for SNAP participants to get access to healthier foods.

I hope the USDA is keeping score on what gets bought online, and whether foods cost more.  The benefits are not allowed to be used for delivery costs.

Dec 14 2016

The pros and cons of taxing foods based on their sugar content

The Urban Institute has just published The Pros and Cons of Taxing Sweetened Beverages Based on Sugar Content.

The report is funded by the American Heart Association and others.  The AHA issued a press release.

The sections of the report state its conclusions:

  • Taxing Sugar Content Is the Least Costly Way to Reduce Sugar Consumption
  • Taxing Based on Sugar Content Is Feasible at the National Level
  • Taxing Based on Sugar Content Raises More Issues at the State and Local Level but Is Generally Feasible As Well

The report concludes:

We conclude that taxing based on the amount of added sugar a drink contains, either by taxing sugar content directly or by levying higher volume taxes on drinks with more sugar, is feasible in many jurisdictions and reduces sugar consumption more effectively than comparable taxes on drink volume.

Broad-based volume or sales taxes on all soft drinks, however, raise revenue more efficiently.

Federal, state, and local policymakers thus face trade-offs between using sweetened-beverage taxes to raise revenue and to discourage consumption of added sugars.

Keep this in mind when trying to do this in your community.

Nov 9 2016

Savor the moment while it lasts: soda taxes pass!

The results, now almost final, look like this:

Soda tax votes in California:

  • San Francisco, CA, Measure V, 1 cent/oz: 62%
  • Oakland, CA, Measure HH, 1 cent/oz:       61%
  • Albany, CA, Measure 01, 1 cent/oz:          71%

And

capture

Recall what this cost, and then some:

Next?  Fingers crossed.

But at least this.