
I’m on the visionary panel. To register, click here.

Every now and then the USDA puts out a collection of its latest charts.
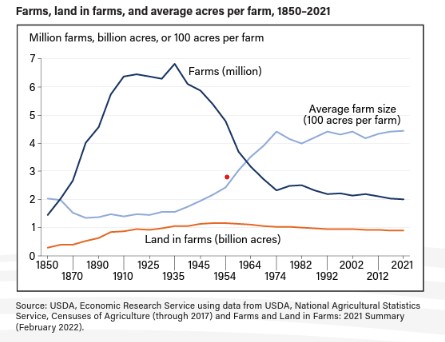
These provide lots of information at a glance. Here are three quick examples:
2. This one is about sweeteners in the food supply (not amounts actually eaten).The peak year was around 2000. The overall trend tracks with corn sweeteners.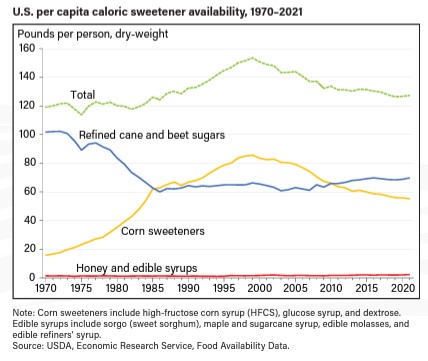
3. More than half of food expenditures are now on food eaten in restaurants or institutions—where meals are higher in calories.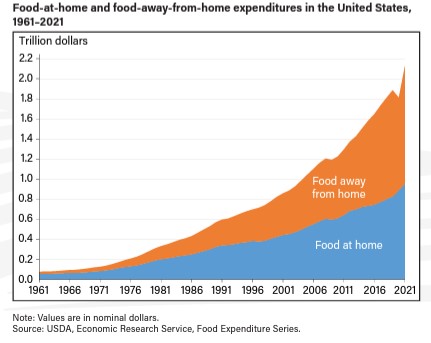
Enjoy!
*******
For 30% off, go to www.ucpress.edu/9780520384156. Use code 21W2240 at checkout.

I’m on the visionary panel. To register, click here.
