by Marion Nestle

Posts dated: October2012

Oct 30 2012

Is USDA changing its sugar consumption estimates? Why?

If I weren’t so concerned about USDA’s dropping its data on calories in the food supply (see previous post), I might not have become so alarmed about the New York Times report on the sudden drop in estimates of sugar consumption.

USDA provides data on amounts reported as consumed, from 1970 to 2011.

These have declined, not necessarily because people are eating less but because USDA changed its methods.

According to the Times account:

In e-mails the center obtained through a Freedom of Information request, officials at sugar industry trade groups discussed the benefits of the lower estimate and how they might persuade the U.S.D.A. to make a change that would reduce it even more.

“We perceive it to be in our interest to see as low a per-capita sweetener consumption estimate as possible,” Jack Roney, director of economics and policy analysis at the American Sugar Alliance, wrote in an e-mail on March 30, 2011.

These figures are for reported intake—always an underestimate.

Reported intake is much lower than amounts of sugars available for consumption—amounts produced, less exports, plus imports—always an overestimate (the truth lies somewhere in between).

Food availability figures also indicate declines, but suggest that Americans have access to about 65 pounds a year each of table sugar and corn syrup for more than 130 pounds per year total.

None of these figures is precise.  But if the methods for calculation are the same every year, trends should be discernible.

Adjusting for waste introduces new sources of error and makes trends impossible to determine.

The USDA used to re-correct the entire food availability series when making changes in methods.  Why aren’t its data collectors doing that now?

We neeed USDA to be keeping up with food availability data.  What to do?

Oct 29 2012

Why isn’t USDA keeping up its series on calories in the food supply?

In November 2011, I wrote about my frustration over the USDA’s discontinuation of a data set it had published continuously since 1909: Nutrients in the Food Supply.   For unfathomable (to me) reasons, USDA stopped the data set in 2006.

For decades—since 1909—USDA has converted information about food availability (the amount of food produced in the U.S., less exports, plus imports) to per capita nutrient availability in a continuous series (it also publishes data on calorie intakes from certain foods). 

This is the data set I use to explain how calories in the food supply have increased to today’s 3,900 per person per day from 3200 in 1980—an increase of 700 calories per day in parallel with rising rates of obesity.

USDA stopped this series in 2006. It now only publishes calorie supply figures that have been adjusted for waste. 

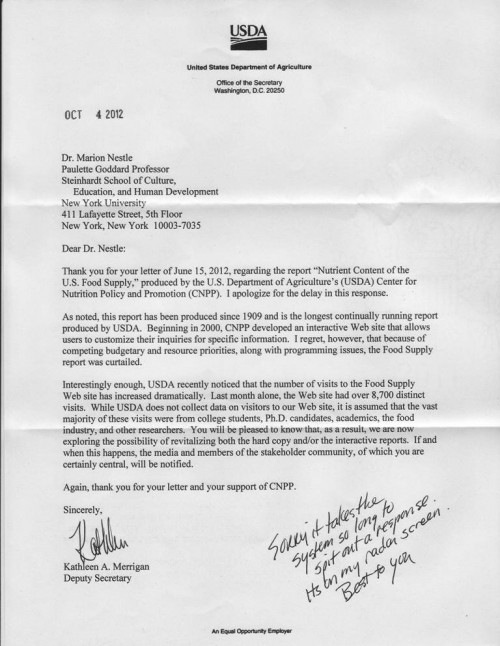
When I wrote USDA to ask whether more recent data were available, here’s what I got back (in its entirety):

Because of other project priorities the Food Supply project has been curtailed.  There are programming issues to which we haven’t been able to devote available resources.

In July this year, I wrote letters to everyone I could think of at USDA who might shed some light on this and, hopefully, restore the data set.  Although I hated to bother her, I even wrote to Deputy Secretary Kathleen Merrigan.

Her reply: 

 As I will discuss in a later post this week about USDA’s data on sugar availability, the agency seems to be changing the way it evaluates food supply data. 

This is bizarre.  USDA must have figures on total calories available in the food supply.  Otherwise, how could it produce figures adjusted for waste? 

I’ve been concerned that I’m the only one who cares about this, but a similar issue has emerged about USDA data on sugar availability.  I’ll write about that once hurricane Sandy blows over.

Tags: ,
Oct 27 2012

Weekend nutrifluff: Eat chocolate, win a Nobel Prize

Nutrifluff is my word for sensational research findings based on one, usually highly preliminary, study.

The best nutrifluff I’ve seen in ages is this article in the august New England Journal of Medicine: “Chocolate Consumption, Cognitive Function, and Nobel Laureates.”

The author counted the number of Nobel laureates per capita from Wikipedia and and computed the number for every 10 million people. 

He obtained data on per capita yearly chocolate consumption in 22 countries from several sources and ran the correlation.

Bingo!  Chocolate consumption correlates with the number of Nobel prize winners.

Correlation, alas, is not causation, but who cares?

Everybody loves chocolate.  Enjoy! (In moderation, of course).

Tags:
Oct 25 2012

An honorary degree from Transylvania University: I’m honored!

Self-promotion alert:

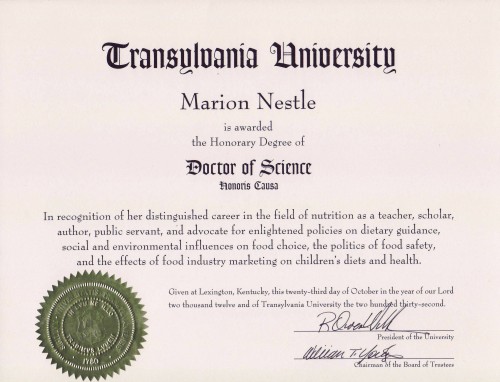
I gave a talk on food politics at Transylvania University  on Tuesday and was given an Doctor of Science degree, honoris causa.

I’ve never gotten an honorary degree before.  In the academic world these are a big deal, so this feels really special.

Want to see what one looks like?  As you might imagine, I like the inscription.

Transylvania University is a small (1,000 students) liberal arts college in Lexington, Kentucky and there’s no point in making vampire jokes.  They’ve already heard them all.

Tags:
Oct 24 2012

What to do about front-of-package food labels?

The British Food Standards Agency has just announced a new front-of-package voluntary labeling system to go onto food packages next year, maybe.

The exact design is still uncertain, but it might look like this:

An example of the what the new hybrid food labels might look like. Shows traffic light sytem, %GDA system and high, medium, low system.

Compare this to the scheme Mark Bittman suggested in the Sunday Times last week.

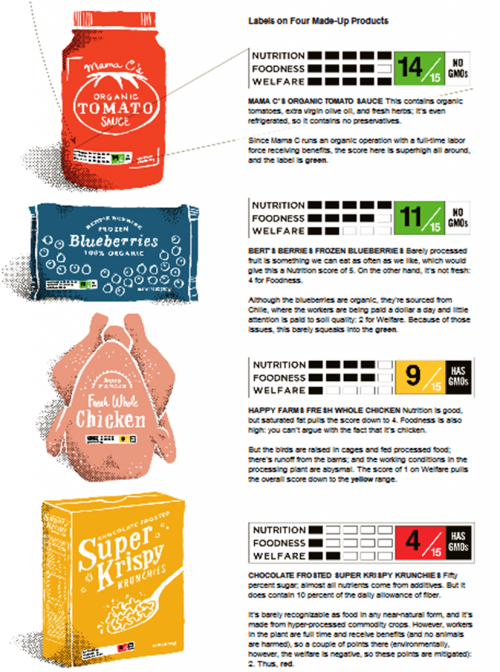
Bittman’s idea does way more.  He suggests one design to

  • Rate foods on the basis of nutrition, “foodness” (an index of the extent of processing), and welfare (of everyone and everything)
  • Give them an overall score and a traffic light ranking (green, yellow, red)
  • Note whether they contain GMOs or not

Here’s how it would look:


Recall that the FDA recruited the Institute of Medicine to recommend a new labeling scheme.  It did just that a year ago, in a report advising the FDA to restrict front-of-package labels to information about calories, saturated and trans fat, sugar, and salt.

Since then, the FDA has said not a word about its food labeling initiative (More research needed? Election-year politics?)

In the meantime, Whole Foods has implemented its own new traffic light labeling scheme, but without those pesky red symbols well established to discourage sales.  If the food doesn’t rate a green or yellow symbol, it won’t have anything on it.

Everybody is doing food rating systems.  The owner of Rouge Tomate has developed SPE certification for restaurants, a system based on “Sourcing, Preparing, and Enhancing philosophy and culinary techniques.”

All of the people doing rating and certification systems set up their own criteria, and all differ.

Are these systems helpful?  Only if you trust that they are meaningful.  I don’t know how to find that out without doing a lot of research.

Readers: Do you like these systems?  Use them? Find them helpful?  I don’t, but am willing to be persuaded otherwise.

Oct 23 2012

Multivitamins prevent cancer (maybe), sell supplements (definitely)

According to a new study in JAMA, multivitamins might reduce the risk of some cancers, although not by much.

But even a tiny benefit, restricted to skin cancers in healthy male doctors—but not prostate cancers, alas—is good news for the supplement industry.  Supplement sellers are eager to make sure you don’t miss this research.

The study results came out on October 18.  Pfizer, the maker of the Centrum Silver pills used in the study, placed this ad in the New York Times on October 19:

But that’s not all.  CVS pharmacy sent me this personal e-mail message:

Pfizer, of course, could not be happier.

Why do I think this is about marketing, not public health?

Oct 22 2012

Rest in peace George McGovern

Former Senator (D-SD) George McGovern died yesterday at age 90.

His accomplishments as a Senator and statesmen were legion, many of them strongly connected to food politics.

As I mentioned in 2009 when I gave the state department’s annual George McGovern lecture in Rome, he chaired the Senate Select Committee on Nutrition and Human Needs from 1968-1977.   This committee greatly expanded food assistance programs and then developed the first federal guidelines for chronic disease prevention: Dietary Goals for the U.S.

In Food Politics, I described the work of this strongly bipartisan committee (Bob Dole was its lead Republican member) and how it did so much to improve the lives of women and children living in poverty in the United States, and of poor people throughout the world.

The committee also broke new ground in shifting nutrition education from a focus on eating more of a variety of foods to eating less of foods that increased risks for chronic disease.

What’s shown here is the February 1977 version of this landmark report.  As the result of outraged protests by food producers affected by the “eat less” messages, the committee was forced to tone down its recommendations.  The committee issued a revised report in December that year.

That was the committee’s final act.  Congress disbanded it and McGovern lost his bid for reelection.

McGovern leaves an extraordinary legacy, one unimaginable in this era of partisan politics.

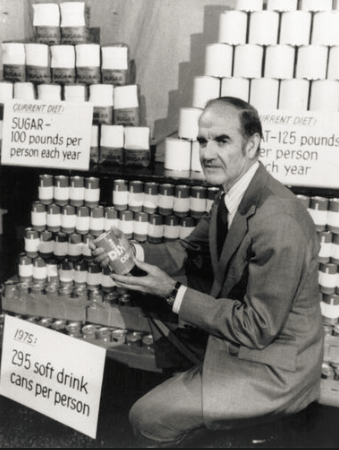
He was far ahead of his time, as this 1977 photo shows.  It is a fitting tribute.

Oct 19 2012

Calories as an instrument of government control?

My 2012 book with Mal Nesheim, Why Calories Count: From Science to Politics, includes a chapter on the use of calories in international relations.

I thought of this chapter while reading a story in yesterday’s New York Times.

Apparently, the Israeli military restricted the amount of food available to residents of Gaza during the blockade that lasted from from 2007 to mid-2010.

The Israeli military calculated the number of calories that the blockaded residents would need to avoid malnutrition.

The purpose of the blockade was to weaken support for Hamas, the militant group that won legislative elections in 2006 and took full control of Gaza in 2007 after a brief factional war…In the calculation, Israel applied an average daily requirement of 2,279 calories per person, in line with World Health Organization guidelines.

I’m not sure where the 2,279 figure comes from.  Calorie estimations established jointly by the Food and Agriculture Organization and the World Health Organization say that adult men aged 20-70 need 2400 to 3000 calories a day on average, depending on age, weight, and physical activity level.  Adult women need 1800 to 2400.

The FAO sets a calorie cut point for populations to define hunger.  It defines populations consuming 1,800 calories per capita per day, on average, as chronically undernourished and hungry.

On this basis, 2,279 will be adequate for some adults—those who are female, smaller, older, and less active.  It is unlikely to be adequate for younger, bigger, more active men.

The Israeli Defense Ministry released this document under a court order.  It would be interesting to see how it arrived at this figure.

For an interesting discussion of the use of calories as an instrument of state power, see Nick Cullather’s “The Hungry World: America’s Cold War Battle against Poverty in Asia.”


Tags: