by Marion Nestle

Currently browsing posts about: Sugars

Oct 15 2020

Good news #4: Successes in reducing sugary drinks

Berkeley, California, ever at the cutting edge of public health nutrition policy, is banning junk food from checkout counters and aisles.

The new policy will require retailers larger than 2,500 square feet to stock healthy food at the register and in areas where customers wait in line, instead of items like chips, soda and candy. It forbids food items with 5 grams of added sugars and 200 milligrams of sodium, chewing gum and mints with added sugars, and beverages with added sugars or artificial sweeteners. In Berkeley, the policy will affect stores like Safeway, Monterey Market, Whole Foods and Berkeley Bowl.

As a result of efforts like these—public health campaigns, soda taxes, and other initiatives—heavy consumption of sugary drinks (more than 500 calories/day) is declining.

According to a recent study, the percentage of children who drink more than 500 calories worth of soft drinks a day declined from 11% to 3%  from 2003 to 2016, and the percentage of adult heavy consumers declined from 13% to 9%.

This trend is in the right direction.

Sep 14 2020

Misleading marketing of the week: maple syrup of all things

My colleague Lisa Sasson, who is a member of the Academy of Nutrition and Dietetics (formerly the American Dietetic Association), sent me a copy of its September 11 newsletter.  This, she pointed out, contains this advertisement for  Canadian maple syrup.

Maple syrup, delicious as it is, is basically sugar(s) in liquid form.

But “health and performance benefits”?  They have to be kidding.  I clicked on Give it a turn!

The first thing up: “Pure Maple Syrup is packed with nutritional benefits.”

Oh come on.  We’re talking sugars here.

But the hype continues:

  • Pure maple syrup from Canada contains vitamins and minerals – at approximately 110 calories per serving (2 tablespoons).  It is an excellent source of manganese and a good source of riboflavin. Pure maple syrup is also a source of calcium, thiamin, potassium, and copper.
  • Scientists have identified more than 67 different plant compounds, or polyphenols, nine of which are unique to pure maple syrup. One of these polyphenols, named Quebecol, naturally forms when the sap is boiled to produce maple syrup.

I went to the USDA’s food composition database to see what it says about maple syrup.  Its figures are pretty close to what’s given in this ad, but so what?  Manganese and riboflavin are hardly nutrients of concern in American diets—many foods have plenty—and all the other nutrients listed are in too small amounts to bother to count.

But it continues:

Maple Syrup for Fitness

  • Pure maple syrup can be a natural endurance booster for athletes because it is made primarily of carbohydrates. Since carbohydrates are the primary fuel for the body, it can help give athletes the energy they need. Use in homemade sports drinks and energy snacks for a readily available supply of energy that helps maintain your stamina.
  • Pure Maple syrup contains manganese, which may help support healthy muscles.

Translation: Eat sugar!

As for manganese,

Manganese is present in a wide variety of foods, including whole grains, clams, oysters, mussels, nuts, soybeans and other legumes, rice, leafy vegetables, coffee, tea, and many spices, such as black pepper [1,2,5,10,11]. Drinking water also contains small amounts of manganese at concentrations of 1 to 100 mcg/L [5]. The top sources of manganese in the diets of U.S. adults are grain products, tea, and vegetables [4].

Maple syrup is delicious and I love it, but it is not a health food and should not be advertised to dietitians as such.  The ad is misleading and makes the Academy look like it’s not on top of efforts to mislead its members.

Sep 8 2020

Marketing ploy of the week—and for schools, yet

Sigh.
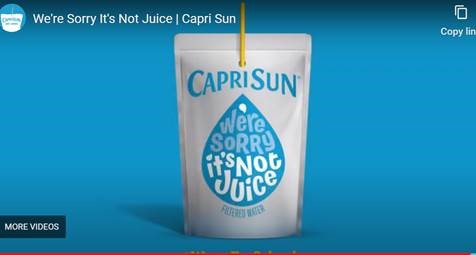
 

According to Business Wire, Kraft Heinz, the company that owns Capri Sun, is donating “5 Million Pouches of CAPRI SUN Filtered Water to School Districts as Schools Turn Off Water Fountains”

The brand apologizes for swapping juice for filtered water and captured reactions of kids in a light-hearted campaign

PITTSBURGH & CHICAGO–(BUSINESS WIRE)–While every schools’ plan to return looks different this year, kids know that recess will be on recess, masks won’t just be for Halloween and that water fountains will be off limits. CAPRI SUN knows this is a hard time for kids, so to help students have a safe and fun way to get water this school year, the brand is swapping its juice for filtered water. CAPRI SUN is donating 5 million filtered water pouches to schools in the Chicagoland area and Granite City, where its factory is located.

The company is running a sweepstakes to accompany its donations.
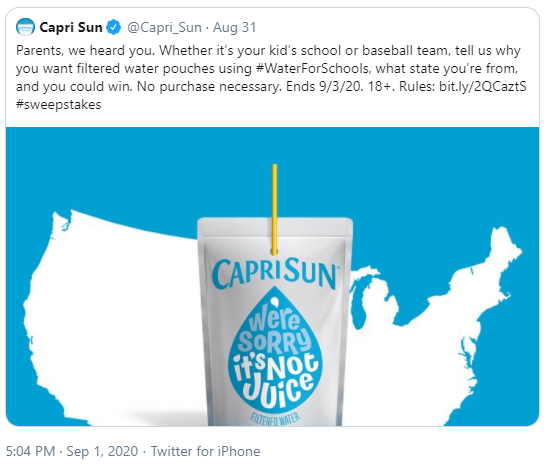
Shouldn’t we be happy that the company is donating water, and not the typical Capri Sun sugary drinks?

No.  Why?

  • This is marketing aimed at children (children can’t tell the difference between information and marketing, unless taught).
  • This is marketing a sugary beverage brand to children (children are highly susceptible to this kind of marketing).
  • This is marketing packaged water to children (tap water is drinkable in most places in the U.S.  If not, schools should be providing readily available urns of water).
  • The total value of the sweepstakes prizes is $400 spread across five “winners”(pretty cheap)
  • Capri Sun markets its products as juice drinks (but typically have 10% or 0% juice)

I was curious to see what the company says about its products, and looked up this one.
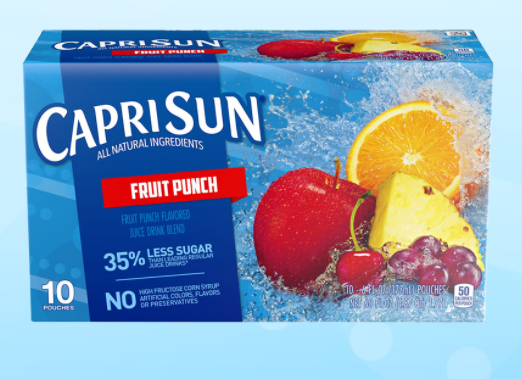
Doesn’t this look healthy?  Here’s what’s in it (note: concentrates are a euphemism for sugars):

FILTERED WATER; SUGAR; PEAR AND GRAPE JUICE CONCENTRATES; CITRIC ACID; ORANGE, APPLE, AND PINEAPPLE JUICE CONCENTRATES; NATURAL FLAVOR.

One pouch contains 13 grams of added sugars.

These are ultraprocessed sugary drinks, best avoided or consumed only rarely, and never marketed to children.

Jul 16 2020

Dietary Guidelines Advisory Committee releases report

The report of the 2020 Dietary Guidelines Advisory Committee is now available in online preprint.

It sets a record at 835 pages.

Its conclusions are highly consistent with those of previous Dietary Guidelines.

It recommends eating more of these foods:

Common characteristics of dietary patterns associated with positive health outcomes include higher intake of vegetables, fruits, legumes, whole grains, low- or nonfat dairy, lean meat and poultry, seafood, nuts, and unsaturated vegetable oils.

It recommends eating less of these foods:

The Committee found that negative (detrimental) health outcomes were associated with dietary patterns characterized by higher intake of red and processed meats, sugar-sweetened foods and beverages, and refined grains.

It retained the recommendation: Eat less red and processed meats

It retained the recommendation to eat less saturated fat (replace with polyunsaturated or monounsaturated)

Thus, the Committee recommends that dietary cholesterol and saturated fat intake be as low as possible within a healthy dietary pattern, and that saturated fat intake be limited to less than of 10 percent of total energy intake, as recommended by the 2015-2020 Dietary Guidelines for Americans. This recommendation applies to adults and children ages 2 years and older.

It tightened up restrictions on alcoholic beverages from 2 drinks a day for men to 1 drink:

The Committee concluded that no evidence exists to relax current Dietary Guidelines for Americans recommendations, and there is evidence to tighten them for men such that recommended limits for both men and women who drink would be 1 drink per day on days when alcohol is consumed.

It tightened up restrictions on added sugars, from 10% of calories to 6%:

After considering the scientific evidence for the potential health impacts of added sugars intake, along with findings from model-based estimations of energy available in the dietary pattern after meeting nutrient requirements, the Committee suggests that less than 6 percent of energy from added sugars is more consistent with a dietary pattern that is nutritionally adequate while avoiding excess energy intake from added sugars than is a pattern with less than 10 percent energy from added sugars.

What’s missing?

  • Salt: The report says remarkably little about sodium beyond that it is overconsumed and people should “reduce sodium intake.”  It’s possible that I missed it, but I could not find suggestions for quantitative limits.
  • Ultraprocessed: The word does not appear in the report except in the references.  A large body of evidence supports an association of ultraprocessed foods to poor health.  If the committee considered this evidence, it did not spell it out explicitly.
  • Sustainability: This was off the table from the beginning but this committee recommends that it be considered next time in the context of a food systems approach to the Dietary Guidelines (p.771).

Comment

This is an impressive, solid, conservative review of the existing science highly consistent with previous Dietary Guidelines but with mostly stronger recommendations.

This committee was up against:

  • A tight time frame
  • A first-time mandate to review literature on infancy, pregnancy, and lactation in addition to that for adults
  • A first-time process in which the agencies set the research agenda, not the committee
  • The Coronavirus pandemic

At the outset, I was concerned that the committee members might be heavily biased in favor of food industry interests.  If they were, such biases do not show up in the final report.  I think this committee deserves much praise for producing a report of this quality under these circumstances.

Want to weigh in on it? 

The agencies are taking public comments until August 13.  On August 11, there will be an online public meeting for even more comments.

What’s next?

This report is advisory, only.  USDA and HHS must boil this down to the actual 2020 Dietary Guidelines.  Whereas the committee process was transparent, the boiling down process is highly secretive, or was in 2015.  It will be interesting to see what the agencies do, especially given the heavy lobbying by proponents of meat, saturated fat, and low-carbohydrate diets.

Jul 2 2020

Sugar in food products: A FoodNavigator collection of articles

I am reprinting this with no comments (beyond really, healthier marshmallows?) from the industry newsletter FoodNavigator.  Here is its

Special Edition: Sweeteners and sugar reduction

Sugar continues to be in the spotlight, singled out as the nutrient responsible for alarming global rates of obesity and type 2 diabetes. Artificial sweeteners are also facing fire from consumers who want to adopt ‘clean’ diets. And while natural sweeteners are a preferred option, ingredients like stevia are notorious for their off notes. So what is the answer? We take a look at the latest thinking around sugar reduction, from the nutritional science underpinning the trend through to tech developments like so-called structured sugars.

Jun 29 2020

Industry-funded research, Australia style

A reader in Australia writes that she “just came upon a doozy of an industry-funded paper.”

Title: Sales of Sugar-Sweetened Beverages in Australia: A Trend Analysis from 1997 to 2018, by William S. Shrapnel and Belinda E. Butcher.  Nutrients 2020, 12, 1016; doi:10.3390/nu12041016.

Conclusion: Major, long-term shifts are occurring in the market for non-alcoholic, water-based beverages in Australia, notably a fall in per capita volume sales of SSBs and an increase in volume sales of water. Both trends are consistent with public health nutrition strategies for obesity prevention and suggest that the downward trend in the percentage of dietary energy from added sugars in the Australian diet may be continuing.

Funding and Conflicts of Interest: This analysis was funded by an unrestricted grant from The Australian Beverages Council Ltd. The funders had no role in the design of the study; in the collection, analyses, or interpretation of data; in the writing of the manuscript, or in the decision to publish the results.

So what’s the problem here (besides the usual questions about the accuracy of the “no role” statement)?

The clue comes from an article in Food Navigator Asia: “Not a taxing question: Australian sugar sweetened beverage consumption slumps as obesity rates continue to soar.”

The article quotes a representative of the Beverage Council:

Obesity is multi-factorial, the reason why people become overweight and then obese, is because of the lack of physical activity, a sedentary lifestyle, and also poor diet…a sugar tax alone would not reduce the obesity rates in the country, and was a complex challenge for the government to overcome.  The beverage industry is against a sugar tax, and SSB tax.  The evidence and science behind the effectiveness of a sugar tax is weak.

Comment: The point of this study is to produce evidence against the value of soda or sugar taxes, even though sodas are still the largest source of sugars in Australian diets, and taxes have been shown to reduce consumption in other countries.  When it comes to sugary drinks, less is better.

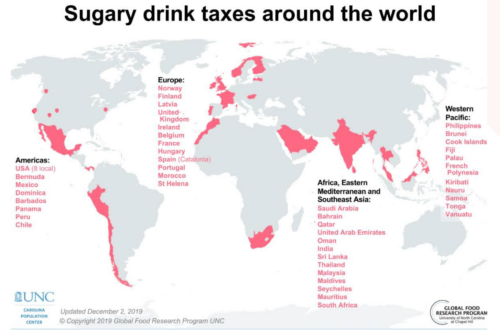
Just for fun, here’s Healthy Food America’s 2019 map of countries with soda taxes.


Mar 4 2020

Coca-Cola wants the 2020 dietary guidelines to say more about beverages

I am indebted to Margarita Raycheva, who writes for the highly informative newsletter, IEG Policy Agribusiness, for her recent article, which certainly got my attention: “Coca-Cola asks DGAC to develop detailed dietary recommendations for beverages” (this is probably behind a paywall).

Her article is about comments filed by Coca-Cola to the DGAC, the 2020 Dietary Guidelines Advisory Committee.  She did not provide a link to those comments, so I had to search for them.  This involved finding the DGAC comments page, searching for Coca-Cola, locating the company’s letter, and opening the pdf attachment.

The 12-page document reads like a highly sophisticated advertisement for Coca-Cola’s astounding number of beverage options, many of them low in sugar or sugar-free.

Over the last few years, Coca-Cola has been transforming to become a total beverage company that meets Americans’ fast-changing preferences across a wide array of beverage categories. We support the World Health Organization’s recommendation that people should limit added sugar to no more than 10% of their total daily calorie consumption1 and are rethinking existing recipes, package sizes and offerings to ensure we are helping consumers manage their daily intake of added sugar and other nutrients from our portfolio.  Today, we offer more than 800 drinks in the U.S. alone, ranging from soft drinks to juices, teas, coffee, dairy, sports drinks, water and more – more than 250 of which are low- or zero-sugar options. More than 40% of our sparkling beverage brands in the U.S. are now available in package sizes that are smaller than 8.5 ounces. We are increasing marketing support for low-sugar, no-sugar and unsweetened products…; we are introducing less sweet versions of classic soft drinks…; and we are accelerating our expansion into new beverage categories through the acquisition of brands….We are taking these actions because we recognize the critical role that we – and the entire industry – can play in advancing nutritional goals by using our scale for good.

Why do this?

• About 15% of energy comes from beverages
• Beverages, such as sweetened soft drinks, coffee and tea contribute more than 40% of daily added sugar intake
• Beverages, mainly milk and 100% juice, contribute over 40% of vitamin C and D intake and more than 20% intake of carbohydrates, calcium, potassium and magnesium
• Fruit intake (0.9 cup/day) is half of recommended levels (2 cups/day); 100% fruit juice contributes up to 24% of fruit intake in children, but decreases after adolescence
• Coffee and tea contribute up to 12% of potassium intake in adults
• Waters contribute up to 10% of calcium intake in adults

In other words, drink more (of our) beverages!

Coca-Cola’s proposals for how beverages can enhance diets:

  • Hydration
  • Nutrition and health
  • Enjoyment
  • Performance

What should the DGAC do?

By creating a framework that includes guidance for all types of beverages, the DGA can help drive Americans towards healthier versions of drinks they are typically consuming. Recommending limited
consumption or small shifts towards healthier beverages is more effective than simply discouraging the consumption of entire beverage categories.

The company’s proposals for how the DGAC can help it sell more beverages include sample statements like these examples [with my translations]:

  • Water should be the primary beverage choice [recommend our bottled water]
  • Milk plays an important role in development and health, and contributes essential nutrients to healthy eating patterns, including protein, calcium, vitamin D and potassium [recommend our milk drinks]
  • When fortified, plant-based beverages may provide nutrients and support consumer choice, but generally should not be considered a replacement for dairy [please don’t recommend almond, soy, or oat milks–we don’t make any of those drinks]
  • Juice contributes to the public’s consumption of essential nutrients, phytonutrient and fruit/vegetable intake [recommend our juice drinks]
  • Coffee and tea are sources of health-promoting phytonutrients and are associated with reduced risk of rtain non-communicable diseases (NCDs) [recommend them; we sell those too]
  • Replace sugar-sweetened beverages >40 kcal that do not contribute significantly to nutrition needs with these beverages to reduce calorie and sugar consumption [if you must recommend avoing sugary beverages, at least recommend replacement with everything else we sell]
  • Sports drinks can be beneficial for individuals who engage in prolonged vigorous physical activity, or those sweating for prolonged hours due to warm to hot temperatures [OK, they have sugar, but recommend them anyway]

I can’t wait to see what the DGAC does with this impressively written document.

Not that it matters, really.  Recall: The DGAC submits the research report, but the agencies—USDA takes the lead this time—write the actual guidelines.

Feb 27 2020

What’s up with sugars?

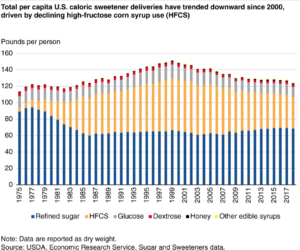
I’m still seeing articles coming out from the USDA’s Economic Research Service, now sadly moved to Kansas City.  This one is based on an older article.*  It’s about how “consumption” of sugars (in quotes because the data actually reflect the availability of sugars in the food supply—production less exports plus imports).

Here’s how I read this chart:

  • Overall sugars are down almost to the level of the late 1970s.
  • Refined (table) sugar dropped at about the time High Fructose Corn Syrup (HFCS) became widely used; it is holding steady.
  • HFCS accounted for the increase in total sugars from 1975-1999.  The subsequent decline is also mainly in HFCS.

The big reason for the decline is lower consumption of soft drinks (these account for nearly half total sugars consumed).

Another trend is substitution of HFCS by table sugar.  This is to the higher cost of HFCS relative to table sugar.  It used to be much cheaper but increased demand for corn to produce ethanol has made HFCS and table sugar cost about the same.

Also, HFCS has a reputation for being worse for health than table sugar, but they are about the same physiologically.  HFCS is glucose and fructose separated.  Table sugar is glucose and fructose stuck together (but quickly separated in the body).

I’m all for eating less of either one.  This, at least, is a healthy trend.

*Sugar and Sweeteners Outlook: July 2019 , by Michael McConnell and David W. Olson, ERS, July 2019